Sunday, 12 April 2015

Coming up next...Bob Roach and the History of the Chemical Industry in Widnes (and maybe Runcorn as well?)

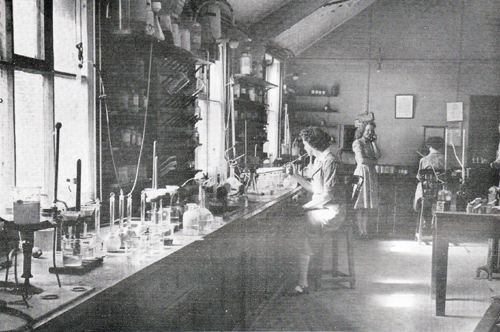
A Corner of the Works Laboratory
The Orr's Zinc White Ltd Laboratories
The next Widnes Sci Bar will feature an insight into the origins of the Chemical Industry in Widnes, delivered by our very own Bob Roach. The Catalyst Centre in Mersey Road provides a series of splendid displays and films that transport  visitors along an amazing journey through the industrialisation of Chemistry, that the region experienced from the middle of the 19th century until the present day. From around 1840, the banks of the River Mersey drew some of the greatest names in Chemistry, who  in turn laid the foundations of an industry that gave its name in 1895, to Widnes Rugby League Football Club: "The Chemics" (although these days they are more often called the Vikings, after an earlier "business" visit!).  Bob will draw on his own background in Science and his passion for Local History to give us his own, personal take on what was and remains, one of the greatest achievements in the history of British Industry. The talk will be delivered on the second Wednesday in May at 7.30pm at the usual venue, the Hillcrest Hotel, Cronton, Widnes.

Thursday, 9 April 2015

Magic, alchemy and science at the Widnes Scibar

Over the last year, the Sci Bar has provided the residents of Widnes with a a wide range of opportunities to catch up on contemporary topics in Science and Technology, ranging from renewable energy through particle physics, to the history of the science of dyestuffs. However, the lecture by Pete Turner entitled: "The Science of Misdirection", provided a rare insight into the challenges that magic and magicians bring to the world of rational Science. Pete combined some breathtaking "tricks" and illusions with a thought-provoking view of the psychology of perception and the skill of misdirection. Starting with an unsettling, pacing around the "stage" in silence, for a minute, he invited us to participate in an "experiment" that would test our perceptions of what was scientifically possible and what we witnessed. Within a few minutes, he had most of the audience in the palm of his hand (well not quite!).

His first "trick" (and incidentally, controversy surrounds the "oldest trick in the book": was it the ball and cup trick, made famous by Tommy Cooper, or the "miraculous" refilling and emptying of a bowl of water? And does it matter?), involved a ring, a long chain and a volunteer, Adrian. As we all sat scratching our heads Pete had managed to achieve the seemingly impossible deception of making the ring thread around the chain, before our eyes. Scientifically impossible, maybe; but we all saw it happen. Or did we? The stage was set for further impressive illusions, including the disappearing silk scarf, which made its reappearance in the wallet of the volunteer, during Pete's "encore". 

Image result for card trickThroughout Pete's "performance" he infused his spellbinding magic with a thoughtful exposure of our gullibility! We all fell for his tactics and almost enjoyed falling prey to his manipulation of our collective audience psychology. As we craved explanations of his unbelievable tricks, Pete's magic circle lips remained sealed. Occasionally he offered a peek into the secret world, but we had to settle for the (by now) familiar realisation that once again he had misdirected us! Pete closed the evening with a couple of card tricks and he did a roaring trade with his booklets on illusions. However, Schroedinger's cat stayed firmly in the bag!

Tuesday, 7 April 2015

The Science of Misdirection

The Next Sci Bar event:

The Science of Misdirection

Pete Turner, Magician

7:30 pm, Wednesday 8th April

Victory Room, Hillcrest Hotel, Cronton Lane, Widnes, WA8 9AR


One of the hardest skills as a magician is making his punters believe that what he is saying is what he is doing. But what the magician seems to be doing is not what he is really doing. ...CONFUSING!
    
Beating the sceptics and preventing the punters from spoiling your magic by being smart requires a special skill. This lecture will give an insight into the field of working as a Close up Magician by showing you how not to be caught out.
 
Also, I will ask someone to come up and challenge them to be awkward and try to beat me. This lecture requires a sharp and eagle eyed audience. It's objective is to beat the sceptics in an interesting and amazing way.

Presented by Friends of Catalyst & the Catalyst Science Discovery Centre

Commentary from Chris Lewis


Image result for energy wordI have just read an article in The Telegraph about the public being kept in the dark over green costs. Those of us attending the last SciBar evening (How Electricity is Priced in the UK, delivered by John Conway and Zack Stevens) are not. John  and Zack  of Eon gave presentations that revealed the charges hidden in electricity bills. Zack spoke first on what influences UK electricity prices, largely the price of gas. He showed how the price of gas is determined by world demand and pinch points where liquified natural gas (and oil) is transported to Europe.  (CL - this is not true in Germany as electricity prices are determined by the world price of coal, much cheaper than using gas. German electricity have fallen as a result of coal prices.)
 
John then took over to break down an electricity bill into its components, over twenty. I threatened to test the audience on Triads that John had explained. He showed how the various green levies are soaring. Only about 60% of electricity bills are for the actual electricity received. Going back to The Telegraph article it clearly states that if green targets were scrapped and substituted with gas then average electricity bills would come down by £214.  Should the electorate be told these figures? 


Looking in more detail showed how the renewables obligation charges, put simply as subsidies for wind farms, are rising by a factor of five over ten years. Feed in tariffs (mainly to subsidise solar panels) have risen by a factor of six over the past two years alone. Then obviously in the background the agreed price for the first new nuclear station will effectively double the price of electricity in real terms. Customers start paying for this later this year.
 
So the question is should Governments come clean (no pun intended) on these costs so voters can make a judgement? What main political party wants to admit this? Politicians either do not understand this, or choose not to. It is better to blame power companies for excessive profits.
 
It should be noted that these are my thoughts, not the thoughts put across by Eon at the SciBar unless specifically stated.
 
Chris Lewis

Sunday, 8 March 2015

Next meeting, Wednesday 11th March at the Hillcrest Hotel Widnes


When?  7:30 pm, Wed 11th March 2015
How Electricity is Priced in the UK
John Conway & Zack Stevens of EON UK Plc
1.            What is lurking behind an electricity price: Explaining  the elements that make up an electricity price. A fully delivered price is made up of 22 separate elements – suppliers’ costs, government low carbon levies; transportation; other industry charges; and with smart operation what can be avoided? – all will be revealed.
2.            Wholesale Market overview: Much more than weather, supply & demand effect the sometimes rollercoaster energy markets.  We’ll explain some of the major global effects like the Middle East; Eurozone Crisis; Global LNG shipments; US Shale gas and even Somali pirates.

Presented by Friends of Catalyst & the Catalyst Science Discovery Centre

Wednesday, 25 February 2015

The Southern Oceans, Widnes SciBar 11th February 2015

The challenge of observing the deep ocean: who cares and why is it so difficult?

Dr Matt Donnelly, British Oceanonographic Data Centre (BODC)

On the 11th February, we welcomed Matt Donnelly a data scientist who works at the British Oceanographic Data Centre who outlined the key physical characteristics of the oceans:
  • water density, largely determined by temperature and salt content,
  • wind patterns at different latitudes that cause ocean currents,
  • temperature,
  • current speed and direction.

The Southern Oceans
These are significant features of the Thermohaline Circulation (thermo - heat; haline - salt). With a transit time of around 1000 years, currents cause an extensive mixing between the ocean basins, reducing differences between them and making the Earth's oceans a global system. On their journey, the currents transport both energy (in the form of heat) and matter (solids, dissolved substances and gases) around the globe. Such circulation has a large impact on the climate of the Earth.

Southern Ocean Matt’s particular interest is in the Southern Ocean, the only ocean that stretches all around the globe, linking the Atlantic, Pacific and Indian Oceans. Unlike other oceans there is no north / south barrier to current flow; as a result, there is a current around the Antarctic continent (the Antarctic Circumpolar Current) that carries more water than any other current in the world. The sea water can be cooled to near freezing at -1.8°C and become highly saline - as a result it sinks to the ocean floor and spreads out over the global oceans as part of the Thermohaline Circulation. Using food dyes Matt demonstrated the how pure water, slightly saline water and highly saline water when introduced into a tank do not readily mix, with the highly saline layer being at the bottom.

Impact of Oceans on Climate The oceans are a massive heat store - the top 5m of oceans have the same heat capacity as the entire atmosphere above them. The ocean currents move cold and warm water around the globe. Heat and moisture are exchanged between the atmosphere and the ocean, effectively acting as one. Climate change theorists had predicted a steady increase in the average temperature across the world. However, for the last 10 years or more this increase hasn’t been as significant, as observed by the conventional methods of measurement - as the heat input continues, where is it going?  One possible explanation is that the heat added by human activity has been absorbed by the oceans and distributed by ocean currents.

Gathering Information about the Oceans Matt described several methods of making measurement - here are a selection.
Ships. Dedicated research ships are the traditional way of studying the oceans & one experienced by Matt in the Southern Ocean. However, this is an expensive way of gathering information and is limited to the route that the ship takes. XBTs (Expendable Bathythermographs) can be dropped from ships not specialising in research (e.g. cargo ships); as it sinks the measurement probe sends data to the ship by wire until  the wire runs out and breaks, and the XBT then sinks to the ocean floor. Seal Tags. A measurement device & transmitter are glued to the rear of a seals head and measurements are received according to the route & depth the seal takes. When the seal moults, the device is lost. Matt showed the trail a seal took circumventing the Antarctic continent.

International Argo project. Matt described this as ‘a game changer’. With international collaboration, large numbers of Argo floats which have controllable buoyancy are dropped into the sea where they are moved by the ocean currents. Powered by batteries, they are programmed to:-
- sink to a specified depth to gather information, e.g. salinity, temperature,
- float with the current for a specified period, still gathering data
- return to the surface and transmit the data they have collected to a satellite,
- repeat this cycle until the battery is exhausted, usually after about 4 years. 

Matt said there are currently 3290 floats in operation, one of which has been operating for 8 years. In his role as a data scientist, he is involved in making use of the vast amount of data received (e.g. reports from 300 floats a day). Part of the international agreement is that the data are freely available to everyone, without restrictions.

Future Methods of Measurement. The Argo floats currently in use are limited to a depth of 1000m. The floats typically park there for ~9 days, descend to 2000m, then record a profile on the way to the surface.  Matt's role is to help ensure access to the data is maintained at all times for the scientific community. However, as the current Argo floats can only reach less than half the average depth of the oceans, the next stage is to deploy floats able to cope with the high pressure of 6km down - little is known about the oceans at such depths. One possible explanation of why the world average temperature has not increased in recent years is that the excess heat has been taken up in the deeper ocean water.

British Oceanographic Data Centre The BODC is a national facility for looking after and distributing data concerning the marine environment. It is hosted by the National Oceanography Centre, at its Joseph Proudman site in Liverpool.

Image result for joseph proudman mathematicianJoseph Proudman.  Joseph Proudman (1888 - 1975) was ‘a distinguished British mathematician and oceanographer of international repute. His theoretical studies into the oceanic tides not only "solved practically all the remaining tidal problems which are soluble within the framework of classical hydrodynamics and analytical mathematics" but laid the basis of tidal prediction service (developed with A. T. Doodson) of great international importance’(Wikipedia). Incidentally, in his pre-university days Joseph lived in Bold and was a teaching assistant at Farnworth, both only a short distance from the Hillcrest Hotel where the SciBar meets. (We'll add a photo of the grammar school when we establish the date!)

Thanks to Matt for a very interesting and enjoyable evening.

Bob Roach
24th Feb 2015 (modified 8th March 2015)